Practical Guide to Homology Modeling
| Many assertions in this article are lacking literature citations. Help improving documentation in this article will be appreciated. Wikipedia's article on Homology modeling is well documented, although more technical and less of a practical guide than the present article. |
TerminologyTerminology
- Query sequence: The amino acid sequence for which a 3D model is wanted. More commonly called the target sequence, but talking about target vs. template gets confusing.
- Template: An empirically determined 3D protein structure with significant sequence similarity to the query.
- "Structure" will be used in this article to mean three-dimensional structure.
What Is A Homology Model?What Is A Homology Model?
Homology models, also called comparative models, are obtained by folding a query protein sequence (also called the target sequence) to fit an empirically-determined template model. The registration between residues in the query and template is determined by an amino acid sequence alignment between the query and template sequences.
- Imagine that the template’s polypeptide backbone is a folded glass tube. Now imagine that the query sequence is a thin metal chain that can be pulled through the tube. The chain (query) will adopt the same fold as the tube (template). The sequence alignment specifies how far the chain should be pulled into the tube; that is, how the residues in the query sequence match up with the structure of the template.
Errors or uncertainties in the sequence alignment result in errors or uncertainties in the homology model. Portions of the query sequence cannot be modeled reliably when there are gaps in the sequence alignment due to insertions/deletions ("indels"), or portions of the template that lack coordinates due to crystallographic disorder. Provided there is sufficient sequence identity between the query and template (at least 30%), the main chain in homology models is usually mostly correct. However, the positions of sidechain rotamers in homology models are usually unreliable.
Nevertheless, homology models are useful for seeing low-resolution features, such as which residues are on the surface or buried, which are close to other features of interest (such as a putative active site), and the overall distribution of charges and evolutionary conservation.
Rationale for homology modelingRationale for homology modeling
The science of predicting the structure of a protein from its sequence, using theory, has very limited success, despite decades of work by some very bright people, and real progress having been made (see Theoretical models).
Structure is more conserved than sequence. This conclusion is supported by many examples of proteins that have similar structures, yet no discernable sequence identity. An example is the ftsZ cell division protein in bacteria which shares structure with mammalian tubulin despite only 12-15% sequence identity[1]. The customary interpretation is that modern proteins with very similar structures have a common ancestor, and that their sequences diverged while maintaining the ancestral 3D structure.
Thus, if the query sequence has significant identity with an empirically determined protein structure (the template), there is a very high probability that they have similar structures. Folding the query sequence identically to the template, guiding the registration by the sequence alignment, produces a homology model.
Do you need a homology model?Do you need a homology model?
You don’t need a homology model if the amino acid sequence of interest (the query sequence) already has an empirically determined 3D structure. Structures determined empirically, by X-ray crystallography or (much less often) by solution NMR, will almost always be more accurate than a homology model.
Is there an empirical model?Is there an empirical model?
All published, empirically-determined, atomic-resolution, macromolecular 3D structures are available in the Protein Data Bank (PDB, pdb.org).
Each model in the PDB has a unique 4-character identification code (PDB ID) that begins with a numeral, and has letters or numerals for the last 3 characters . Examples are 1d66, 4mdh, 9ins.
Here are two methods for finding out if your query amino acid sequence, or parts of it, have empirically-determined 3D structures in the PDB.
Simple search for empirical models (via PIR)Simple search for empirical models (via PIR)
At UniProt.Org, find your protein and click on Structure (blue button at the left).
- If there is a section 3D Structure Databases with a column labeled Entry containing 4-character PDB IDs, these are empirical structures for your protein. Pay attention to the “Positions” column, which gives the sequence number range covered by each model.
- To explore one of these models, write down its 4-character PDB code. Then see #How To Explore 3D Models below.
- If there is no “Entry” column, then there are no sequence-identical empirical structures for your protein. Then try the Advanced search method below.
- Some proteins have no Structure section (e.g. K4QDG1_SACBA). Then try the Advanced search method below.
If empirical structures exist, see #How To Explore 3D Models below. If they are satisfactory, then you don't need a homology model.
Advanced search for empirical models (RCSB PDB)Advanced search for empirical models (RCSB PDB)
This method takes more time but gives you more information. It will find empirical structures that have sequence similarity to the query. Such hits enable a high-quality homology model.
For example, if your query is calmodulin from the lancelet fish (Q9UB37, CALM2_BRALA), zero empirical structures are listed at UniProt. However, the query is 97% sequence identical to human calmodulin (P62158 CALM_HUMAN) and calmodulins from other taxa, for which there are numerous full-length empirical structures. A very high quality homology model can be constructed.
Advanced search procedure:
- Copy the FASTA format sequence for your protein, for example, from UniProt.Org.
- Note the length of your sequence.
- At pdb.org, go to Advanced Search.
- Click on “Choose a query type” and select Sequence under “Sequence Features”.
- Paste your query sequence into the large box, and click the “Submit Query” button at the lower right of the search interface box.
- The best hits will be listed first, starting below “Showing 1-25 of XXX Results”. Notice that each hit starts with a large, bold PDB ID. In the “Alignment” section of the first hit, click on “Display for All Results”. Also in the “Compound” section, click “Display for All Results”.
For each hit, notice the “Identities” above the sequence alignment box. The denominator tells you the length of the sequence alignment. The percentage tells you the sequence identity of the alignment.
For example, “Identities: 355/1045 (34%)” means that 1,045 residues of your query sequence align to the hit with 34% sequence identity (355 identical residues in the alignment). Knowing that my query had length 1,170 residues, I can see that this potential template for a homology model would enable me to model 1,045/1,170 = 89% of my query sequence. Quite often the alignment would span a much smaller portion of the full-length sequence.
BEWARE! The sequence identity percentage may be underestimated at pdb.org. This happens when pdb.org deems segments of the query sequence to be of low complexity. Such segments are marked with X’s in the sequence alignment, and excluded from the calculation of sequence identity. For example, for Saccharomyces gal4 (UniProt P04386), for the top hit (3coq), pdb.org reports “Identities: 71/89 (80%)”, while in fact the sequence identity is 100%. Note this in the sequence alignment at pdb.org:

The 18 residues marked X were not included in the identity calculation. In contrast, when the same sequence search is performed at PDB-Europe, 100% sequence identity is reported. However, other aspects of the report at PDB-Europe are less satisfactory (e.g. the length of the alignment is not stated; the sequences are not numbered) and hence we recommend using pdb.org despite its misleading sequence identity percentages. But you may certainly want to run the sequence search at PDB-Europe to compare the reported identity percentages.
Are parts (or all) of the query protein intrinsically disordered?Are parts (or all) of the query protein intrinsically disordered?
Attempts to determine structure for intrinsically disordered protein will be futile. Therefore, before considering homology modeling or crystallization experiments, it is important to predict whether portions of the query protein are likely to be intrinsically disordered.
Although fold is required for the function of most proteins, some proteins are intrinsically disordered (natively unstructured) and do not fold, at least by themselves. Often, intrinsically disordered protein transitions to an ordered state when it binds to a folded partner protein. However some proteins remain disordered while performing their functions.
By some estimates, 10% of proteins are intrinsically disordered for their full lengths, and about 40% of eukaryotic proteins have at least one loop 50 residues or longer that is intrinsically disordered. These disordered loops are typically missing from X-ray crystallographic structures because the disorder blurs that portion of the electron density map.
Examples:
- Folded: Pyruvate kinase (length 531; e.g. P11979, KPYM_FELCA) has no disordered regions. The crystal structure (1pkm) lacks only 11 residues at the C terminus.
- Partially folded: The tumor suppressor protein p53 (length 393; e.g. P04637, P53_HUMAN) is intrinsically disordered at both the N and C termini. There are many crystallographic structures for the folded mid-region (~200 residues), which lack coordinates for 90-some residues at the N terminus, and 90-some at the C terminus. Some solution NMR structures of the N terminus illustrate the disorder (e.g. 2ly4).
- Unfolded: Caldesmon from chicken gizzard (length 771; P12957, CALD1_CHICK) has no crystal structures, and is predicted to be disordered for essentially its full length.
Prediction of intrinsic disorderPrediction of intrinsic disorder
MobiDB via UniProtMobiDB via UniProt
At UniProt.Org, find your protein, then click on “Structure”. At the bottom of this section is usually a link to MobiDB’s report for the query protein. There, in the section Detailed Disorder Annotations are graphics showing experimental evidence for disorder (if available) and, under the heading Predictors, results from several servers designed to predict intrinsic disorder.
The Examples above are linked to MobiDB.
FoldIndexFoldIndex
The FoldIndex server is a useful adjunct to the MobiDB report, since it is not included in that report.
Is your query protein in the structural genomics pipeline?Is your query protein in the structural genomics pipeline?
Structural Genomics is a worldwide initiative that gained momentum in the early 2000’s. Sequences may be chosen for structure determination because they represent a family of sequences for which no member has an empirical 3D structure. It is possible that your query (target) sequence has been selected for structure determination. Although funding enthusiasm for structural genomics has waned in recent years, some institutions do register their target sequences and progress. You can find out whether your sequence has been selected, and how much progress has been made, at the TargetTrack database. If your sequence has been selected, and progress has reached diffraction quality crystals, it may be worthwhile to contact the institution to see if they can expedite publication of the structure.
Limitations of Homology ModelingLimitations of Homology Modeling
To create a 3D homology model (also called a comparative model) for a query sequence, the first step is to find a template: a reliable empirical structure with significant sequence identity. Depending on the stringency of your sequence identity criteria, templates will be available for no more than ~30% of query sequences.
Full-length templates are unlikely to be found for larger proteins (>~200 residues). 89% of structures in the Protein Data Bank were determined by X-ray crystallography. Most crystallographic structures represent fragments of full-length proteins, because fragments generally give higher crystallization success[2]. 10% of structures in the Protein Data Bank were determined by solution NMR, but these tend to be small proteins or single domains. The median molecular mass of structures determined by NMR is 10 KD[3] (about 90 amino acids[4]). NMR is generally not able to determine atomic resolution structures for proteins >30 KD.
In contrast, the median molecular mass of asymmetric units determined by X-ray crystallography is 50 KD[3], and a few are very large, such as virus capsids (e.g. 4qyk, ~2 million Daltons; 4v99, 10 million Daltons) or ribosomes (e.g. 4w2i, 4.5 million Daltons).
Errors and uncertainties in the sequence alignment produce errors in the homology modelErrors and uncertainties in the sequence alignment produce errors in the homology model
The quality of a homology model depends upon the quality of the alignment between the query and template sequences. When the sequence identity falls below about 35%, the chances increase for errors in the alignment. Errors in the sequence alignment result in errors in positioning the query residues on the template fold; that is, errors in the 3D model.
Gaps in the sequence alignment make errors in the model. Gaps are opened in a sequence alignment in order to optimize the alignment. Such gaps may be regarded as insertions or deletions, but since it is usually unclear which, these are commonly called by the noncommittal term indels. The presence of large numbers of gapped residues in a sequence alignment guarantees that there will be errors in the homology model: missing residues, or residues in incorrect positions.
- A gap in the template sequence means that the corresponding portion of the query is untemplated. Different homology modeling servers handle this differently. Swiss-Model includes the untemplated query residues, putting them in a loop (which may extend some distance away from the remainder of the domain when the loop is long).
- A gap in the query sequence means that the two residues flanking the gap will usually be peptide-bonded in the 3D model, yet the aligned template residues may not be close to each other.
Templates determined by crystallography often have missing residues. FirstGlance in Jmol reports missing residues and marks their locations clearly. Missing residues have no coordinates in the crystallographic model due to disorder of those residues in the crystal. Thus, even though the sequences may align, some residues are frequently absent in the 3D template, and it is unclear where to position those residues. Some homology modeling servers omit such residues entirely, producing an incomplete homology model.
Sidechain rotamer positions will be incorrectSidechain rotamer positions will be incorrect
Even when the sequence alignment and template result in a correct backbone fold for the homology model, the sidechain rotamer positions will be incorrect. Despite knowing where each alpha carbon atom is located, theory does not correctly predict how the sidechains will fit together. At best, the sidechain rotamer positions will avoid steric clashes and electrostatic repulsions of like charges, and may optimize some salt bridges and hydrogen bonds. However, when a high quality empirical model becomes available, the details of sidechain packing in the homology model will be shown to be incorrect.
Strengths of Homology ModelsStrengths of Homology Models
Given the limitations explained above, you might well wonder whether homology models have any uses. Provided that the sequence alignment is reliable (about 35% identity or more), and if the sequence alignment lacks numerous or large gaps (indels), the backbone fold is likely to be correct. This provides a great deal of information despite the inaccuracies in sidechain positions.
- The model suggests which residues are on the surface and which are buried.
- If mutagenesis studies have shown phenotypic changes, it will be useful to see where the crucial residues lie in the homology model.
- The distribution of evolutionarily conserved residues may suggest functional sites. For example, coloring the homology model by evolutionary conservation (e.g. with the ConSurf Server) may show patches or pockets of highly conserved residues. Pay attention to which residues may be missing from the homology model for the reasons explained above. Some missing residues could be highly conserved.
- The distribution of charges on the surface may be useful. For example, a large region or pocket with exclusively positive charges may be a binding site for nucleotides, DNA or RNA. A region devoid of charges suggests interaction with something hydrophobic[5]Remember that the fine details of charge distribution will be incorrect; however the general arrangement may be informative. Also pay attention to whether some charged residues are missing in the model, as explained above, due to gaps in the sequence alignment or missing residues in the template. FirstGlance in Jmol quantitates missing charges.
Example: Structure of E. coli DnaC helicase loader is an analysis of a homology model.
How to obtain homology modelsHow to obtain homology models
Pre-Calculated ModelsPre-Calculated Models
At UniProt.Org, find your protein and click on Structure.
Protein Model PortalProtein Model Portal
Under the subheading 3D Structure Databases, click on the linked UniProt ID at ProteinModelPortal. Here you will find bar graphics showing the coverage by pre-calculated homology models. Touching the blue bars reports the sequence range for each model.
Below is a table listing sequence ranges and percentages of sequence identity. Clicking on [Show] give you a report with a link to download the homology model.
Notice the section at the bottom of the page Remodel this protein. This is a good option if you don't find a satisfactory model.
SMR: Swiss Model RepositorySMR: Swiss Model Repository
This give you similar coverage graphics, but limited to models generated by Swiss Model. Clicking on any one blue graphic bar shows details below, including links to download the model.
ModBaseModBase
Notice, in the blue box Dataset Information at top right, the date of the latest calculation. You may wish to click start a new calculation to take advantage of more recent templates.
The initial page does not list all models. Open the pull-down menu Select Option, and pick Model Details. Now there is a table below with information about each pre-calculated model. Don't confuse the column PDB Segment with the coverage range, which is in the right-most column as graphics.
Sometimes a model is listed by ModBase that was not listed at ProteinModelPortal or SwissModelRepository (due to low sequence identity, higher unreliability).
To download a model, open the pull-down menu and pick Coordinates.
Generating New ModelsGenerating New Models
This process ensures that you are using the latest templates, and may generate a model with better coverage (and likely lower sequence identity) than the pre-calculated models. It also enables you to select the template that you would prefer to use when several are available.
- At UniProt.Org, find your sequence, and copy it in FASTA format.
- Go to SwissModel.expasy.org.
- It is a good idea to create an account, and login. This makes it easy to find your models later, although they are not kept on the server more than a week.
- Open the menu Modelling at the top, and select Automated Mode.
- Paste your sequence into the box, give the project a title, and click Build Model. Processing can take from a few minutes to a few hours.
The results will have a table listing percentages of sequence identity, and templates used. Below will be molecular images for the models. Click on a molecular image to open more information. In the box that opens, click the symbol at right that looks like "v" to open more details.
To download a model, right-click on the blue button Model 01 (or 02, 03, etc.) and pick Download Linked File.
On the Summary page (you may need to click a link Summary), it is worthwhile to click Show full template details. This table shows coverage for each model. You may want a model from this table that was not selected by Swiss Model. If you open out the row for a particular model (click on the "v" at the right), there is a blue button to Build Model.
How To Explore 3D ModelsHow To Explore 3D Models
There are many superb molecular graphics programs. Most are quite challenging to use ("not user friendly").
FirstGlance in JmolFirstGlance in Jmol
FirstGlance in Jmol is perhaps easiest to use, has a great deal of help for interpreting what you see, and is nevertheless quite powerful. (See What Is FirstGlance in Jmol? and FirstGlance in Jmol.)
- Empirical model (PDB code)
- Write down the PDB code of interest.
- Go to FirstGlance.Jmol.Org.
- Enter your PDB code in the slot.
- Homology Model
- Download your homology model(s).
- Go to FirstGlance.Jmol.Org.
- Click on Upload your own PDB file and designate your homology model. Click View in FirstGlance. Your molecule should appear momentarily.
Hydrophobic/PolarHydrophobic/Polar
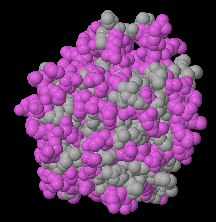
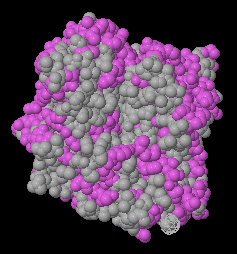
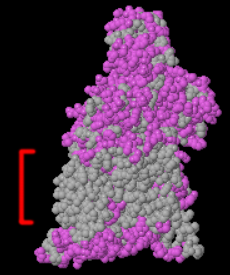
Most of the views under the Views tab will be informative. Particularly important is the Hydrophobic/Polar view. Soluble proteins should not have large areas (> ~ 15 Å across) of hydrophobic surface. Polar residues should be sprinkled over the entire surface. An exception is lipases, e.g. 1lpm, where the pocket at the catalytic site is hydrophobic. Other exceptions would, of course, be insoluble proteins, such as integral or trans-membrane proteins, e.g. 1bl8, 7ahl.
| Hydrophobic, Polar | ||
|---|---|---|

|

|

|
| Hydrophilic surface of a homology model. | Hydrophobic catalytic face of lipase (1lpm). | Transmembrane protein (3waj) Transmembrane hydrophobic zone is indicated by the red bracket. |
Hydrophobic CoreHydrophobic Core
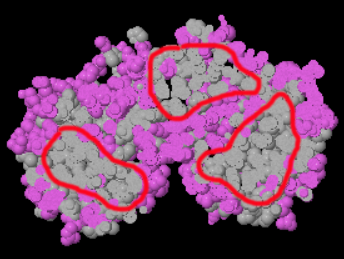
Soluble proteins should have a well-defined hydrophobic core. To see this in FirstGlance, under the Views tab, click Hydrophobic/Polar, and then turn on the Slab button. If the protein has multiple domains, each domain should have a hydrophobic core. If there is no hydrophobic core in a soluble protein model, the model most likely has very substantial errors.
| Hydrophobic, Polar |
|---|

|
| Hydrophobic cores in domains (circled in red; 4cpa). |
Charge DistributionCharge Distribution
Evolutionary ConservationEvolutionary Conservation
Patches of highly conserved amino acids in a homology model can be very informative, as such patches indicate functional sites.
- Go to the ConSurf Server: ConSurf.tau.ac.il.
- Click Amino Acids.
- Click YES there is a known protein structure.
- Enter your PDB code, or click Choose File to upload a homology model. Click Next.
- Select the chain of interest. For a homology model, there will usually be only one chain, "A".
- Select NO you have not prepared a Multiple Sequence Alignment (MSA) that you wish to upload. The server will generate the MSA for you.
- Check 'Let me select the sequences'. Leave all other settings at their defaults.
- Enter a job title and your email address, then click the Submit button. The first step, gathering similar sequences, typically takes less than 5 minutes.
- When the sequences are gathered, you will see SELECT SEQUENCES.
See AlsoSee Also
- Homology modeling
- Homology modeling servers discusses how some servers handle gaps in the sequence alignment.
- Homology modeling in Wikipedia.
- User:Wayne Decatur/Homology Modeling has an annotated list of relevant resources.
- Theoretical models
Notes and ReferencesNotes and References
- ↑ A 3D structure similarity search gives tubulin as one of the closest matches to ftsZ, with an RMSD (alpha carbons) of <2.6 Å.
- ↑ The overall success rate for solving the 3D structure of a given protein sequence is about 5%. Failures commonly occur because the expressed protein is not sufficiently soluble (about half of expressed sequences), because soluble proteins fail to crystallize, or because crystals are not well ordered.
- ↑ 3.0 3.1 Median molecular masses in the PDB were determined in December, 2014.
- ↑ The average mass of an amino acid is 111.4 Daltons, weighted according to the frequencies of occurrences in proteins.
- ↑ Lipases commonly have a hydrophobic surface (devoid of charges) around their active sites. See Lipase lid morph.